The following represents the opinions of Innealta Capital and are subject to change at any point.
Last month we expected Q3Y2021 corporate earnings to be the primary influence in financial market news, and the announcements did not disappoint. Heading into the Q3Y2021 U.S. earnings season, the market was expecting a 27.4% growth rate. While the earnings season has not yet concluded, as of October 31st, the growth rate was 36.6%[1]. This month, we expect financial market news to focus on various inflation data points, the U.S. Federal Reserve Bank’s (“Fed”) policy meeting, and whether two new rounds of fiscal stimulus will pass in U.S. Congress.
Rising Inflation
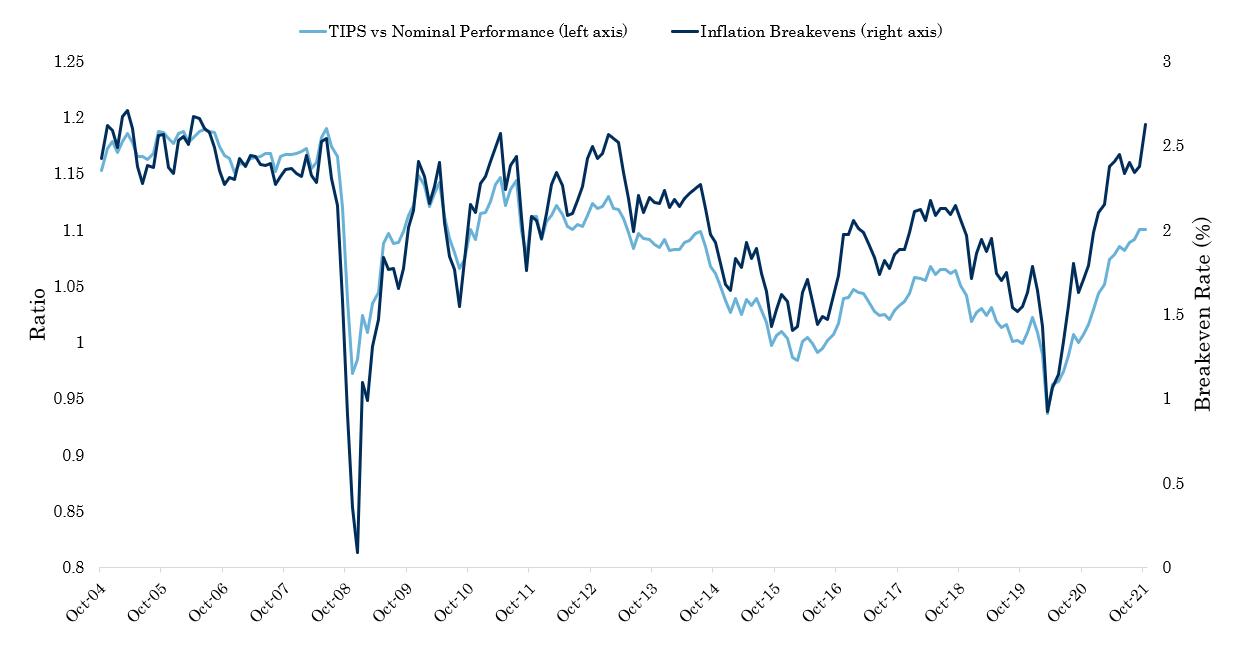
Inflation remains a top market concern for investors as rising inflation erodes purchasing power. Last month the U.S. Consumer Price Index (“CPI”) increased by 5.4% year-over-year. While the CPI measures actual inflation that occurred, market-based metrics provide insight into inflation expectations. Specifically, the ten-year U.S. breakeven rate, which is the market-implied inflation rate ten years from now, is at the highest recorded levels since 2003. While U.S. breakevens have increased, treasury inflation protected fixed has outperformed nominal fixed income of similar maturity. We expect inflation breakevens to continue to increase, and the November 10th, 2021 reading of the October CPI will likely reinforce the upward trend.
Figure 1. Market Implied Inflation Metrics
Monetary Policy
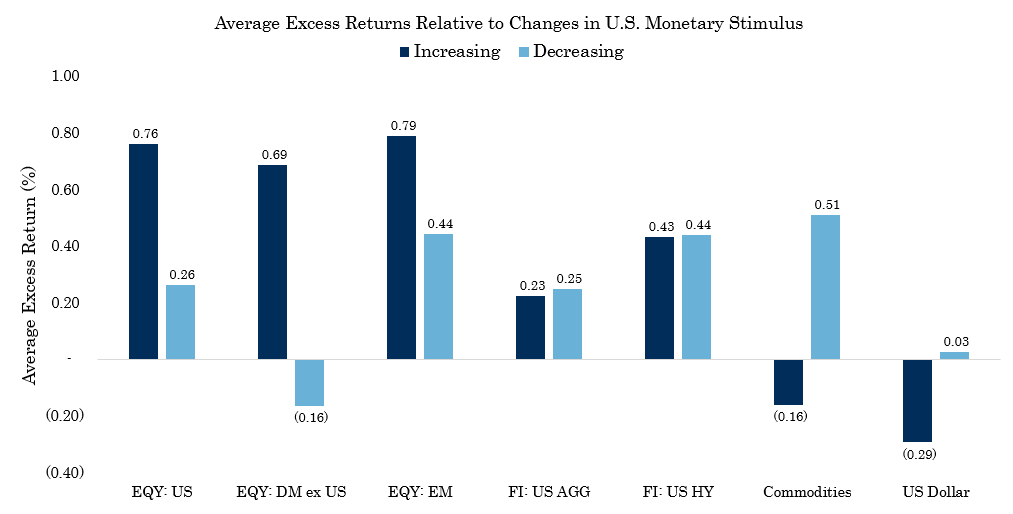
During the Fed’s November meeting, we expect them to announce a reduction in their asset purchase program and leave interest rate policy unchanged. Assuming accommodative monetary policy helped drive financial market prices higher over the past two years, the big question will be which of the two monetary policy tools, asset purchases or interest rates, have a larger impact on financial markets. Historically when the Fed’s balance sheets have increased, risky markets, such as equities, have performed well. While a declining Fed Balance sheet does not imply a negative return, nonetheless, in our opinion, it does suggest a headwind.
Figure 2. Cross Asset Returns During U.S. Monetary Policy Stimulus
Fiscal Stimulus
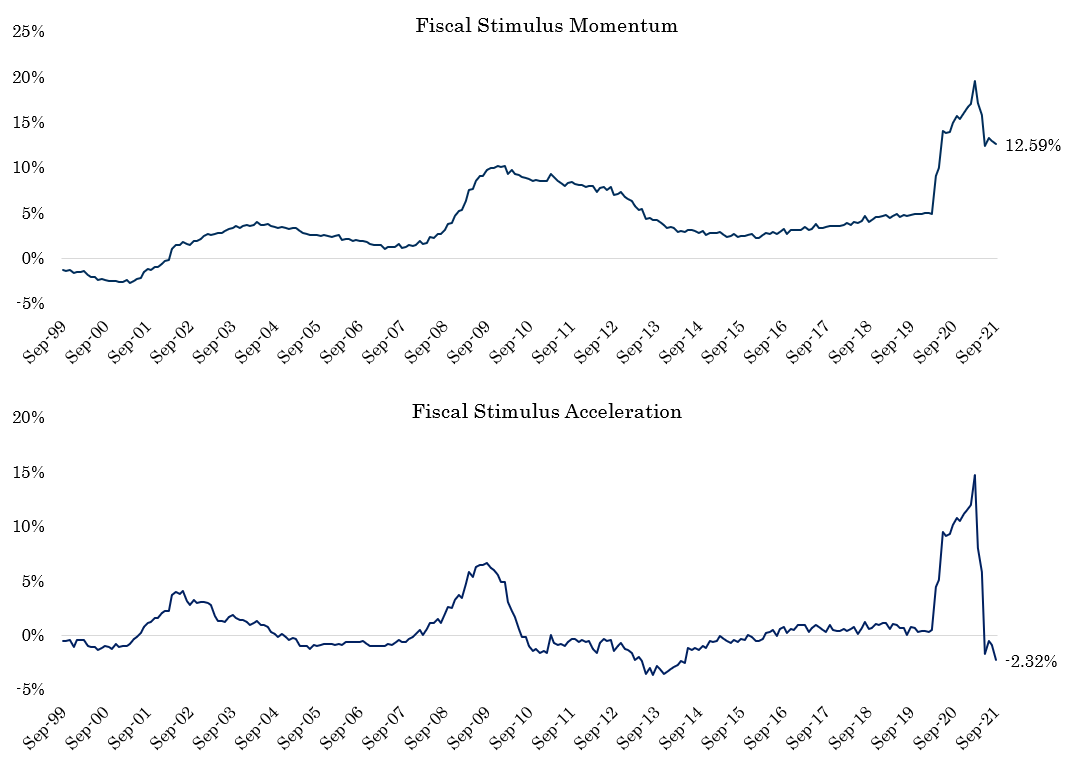
Over the past two years, the United States Legislature has passed a record amount of fiscal stimulus. We defined a fiscal stimulus metric as the U.S. budget deficit over the past four quarters, normalized by the average gross domestic product (“GDP”) during those four quarters. This metric has the advantage of capturing both tax changes and spending programs, which impact revenues and costs respectively. Figure 3 shows that U.S. fiscal stimulus accelerated sharply during the COVID-19 crisis. While the U.S. fiscal stimulus remains elevated relative to history, its acceleration has turned negative. The deceleration implies that without additional fiscal incentives, we would expect budget deficits to a range between 3 and 5% of U.S. GDP. Even though the U.S. Congress already passed a $1.2 trillion infrastructure bill, which many expected, we believe the big question is whether or not additional stimulus is possible.
Figure 3. Fiscal Stimulus Growth
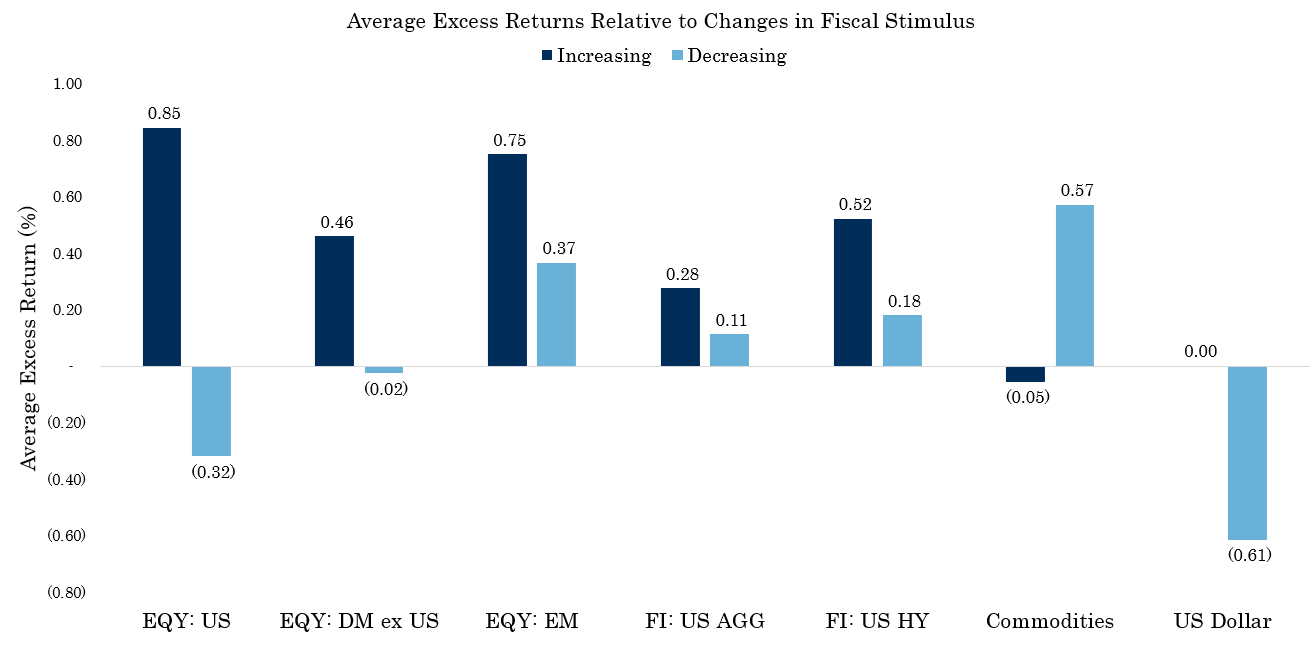
Currently, U.S. legislators are debating more rounds of fiscal stimulus across two or three bills that would add up to a total of $0.5–4.0 trillion of monetary stimulus. Whether the U.S. government should increase its deficit spending is up for debate, however in our opinion, the financial market impact to increasing fiscal stimulus is obvious. During periods of rising fiscal stimulus, risky assets such as equities, high-yield credit, and commodities perform well. Unlike U.S. monetary policy, which Fed officials have well guided, U.S. fiscal policy is difficult to forecast. The votes for or against additional monetary incentives appear close to the 50/50 point, and the event’s timing is completely uncertain at this point.
Figure 4. Asset Clas Performance during different periods of Fiscal Stimulus
To summarize, year-to-date, macroeconomic dynamics have dominated financial markets and we don’t expect that to change for the next few months. While Q3Y2021 corporate earnings are likely to show strong growth relative to history, we believe that financial markets have already discounted that growth. We expect financial market volatility, particularly in fixed income markets, to increase as U.S. monetary policy support starts to decline. Moreover, U.S. fiscal policy has the potential to influence financial markets dramatically, and as of this writing, handicapping the likelihood of additional stimulus feels like a coin flip.
References
- Factset Earnings Insight October 29th, 2021
Category Descriptions
- – US EQY refers to U.S. Equities. The Russell 3000 Total Return Index was used to proxy U.S. equity returns.
- – DM EQY refers developed market equities outside of the U.S.. The MSCI World ex-U.S. Net Total Return Index was used to proxy developed market ex-U.S. equities.
- – EM EQY refers to emerging market equities. The MSCI Emerging Market Net Total Return Index was used to proxy emerging market equities.
- – FI US AGG refers to U.S. investment grade, fixed income. The Bloomberg Barclays U.S. Aggregate bond index was used ot proxy investment grade, U.S. fixed income.
- – FI US HY refers to U.S. high-yield fixed income. The Bloomberg Barclays U.S. High Yield Corporate Bond index was used as a proxy.
- – Commodities refers to broad based commodities. The S&P GSCI Total Return Index was used as a proxy.
- – Dollar refers to the U.S. dollar Index. The U.S. dollar index represents the performance of the U.S. dollar against a fixed basket of other developed market currencies.
Disclosures
This material is for informational purposes and is intended to be used for educational and illustrative purposes only. It is not designed to cover every aspect of the relevant markets and is not intended to be used as a general guide to investing or as a source of any specific investment recommendation. It is not intended as an offer or solicitation for the purchase or sale of any financial instrument, investment product or service. This material does not constitute investment advice, nor is it a substitute for such professional advice or services, nor should it be used as a basis for any decision or action that may affect your business. Before making any decision or taking any action that may affect your business, you should consult a qualified professional adviser. In preparing this material we have relied upon data supplied to us by third parties. The information has been compiled from sources believed to be reliable, but no representation or warranty, express or implied, is made by Innealta Capital, LLC as to its accuracy, completeness or correctness. Innealta Capital, LLC does not guarantee that the information supplied is accurate, complete, or timely, or make any warranties with regard to the results obtained from its use. Innealta Capital, LLC has no obligations to update any such information.
897-INN-11/10/2021